THE GOAL
Increase amount users invest by
showing chart data to better inform.
showing chart data to better inform.
Role: Project Lead
THE ISSUE
In the User Research project focused on user engagement, Price Charts was one of the most requested features. Users expressed that they didn’t have enough information to execute a trade. In other applications and websites, they are given many tools to do research on crypocurrency before making a trade. Providing price chart data would allow users to perform useful research within the Abra app.
THE COMPETITION
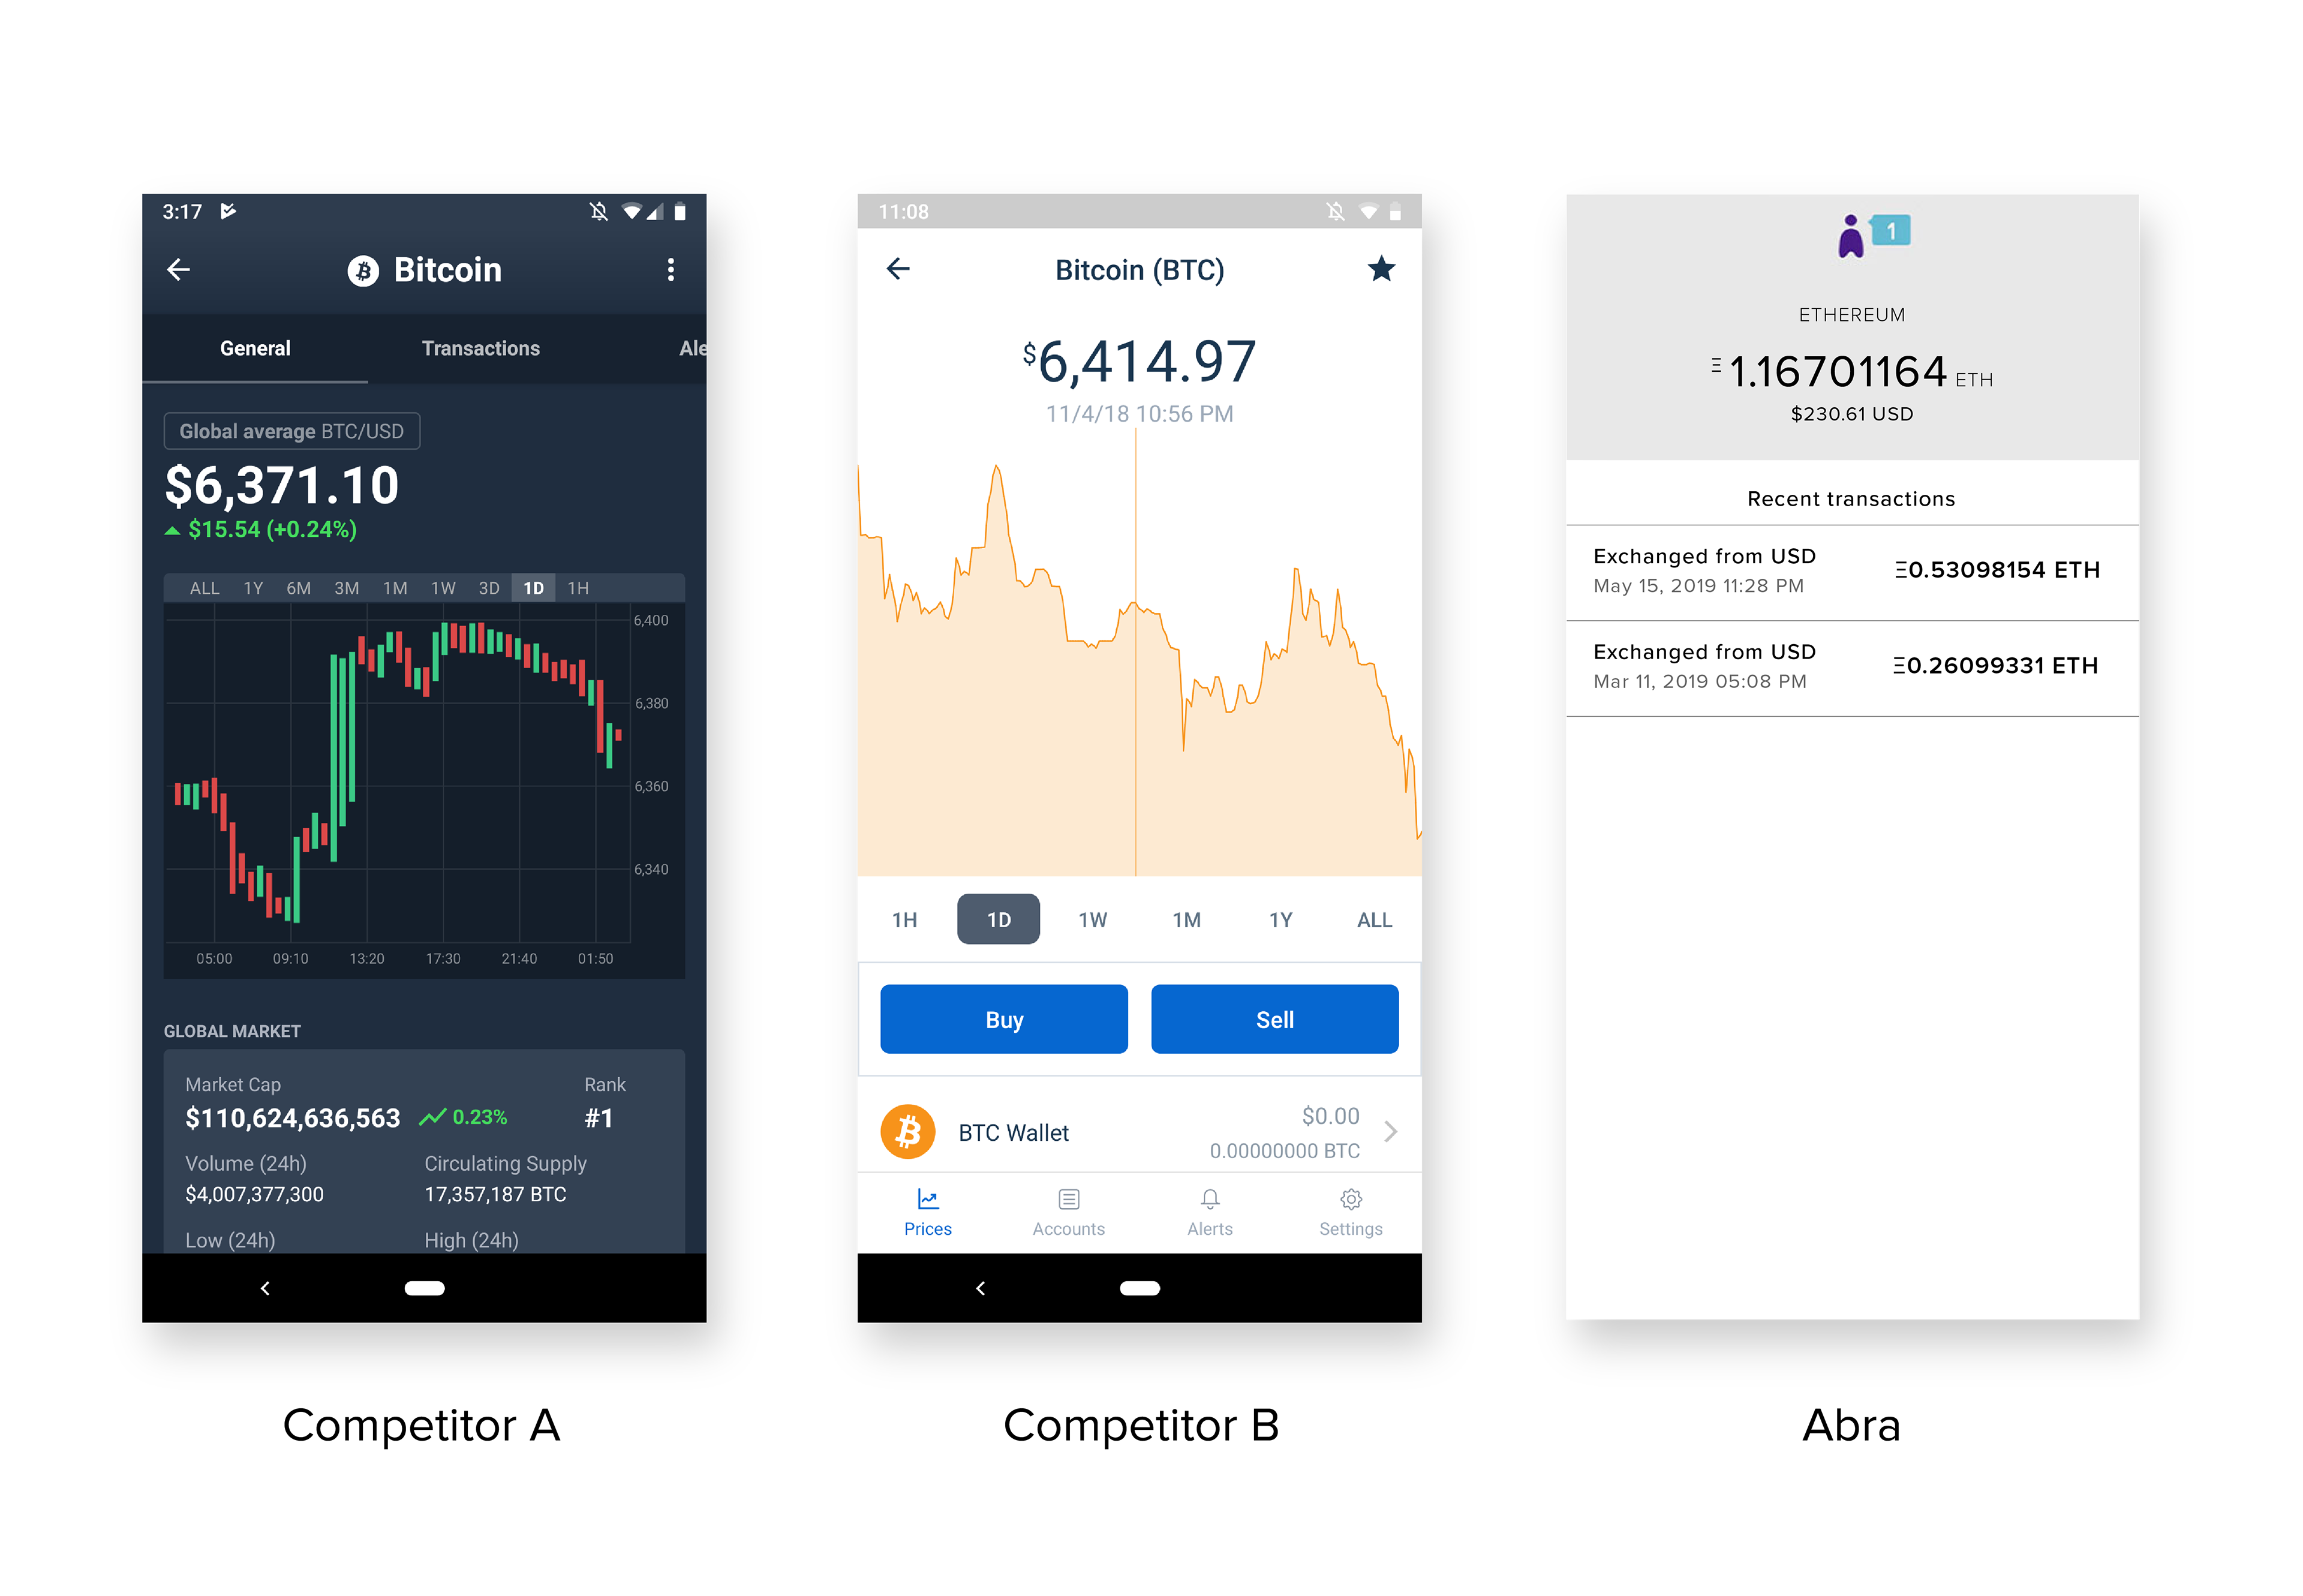
USER FEEDBACK
“Other apps show you price charts, often over years”
“At a minimum I’d expect to see a chart with prices from when they began”
“Charts, alerts and news would make Abra my only crypto app”
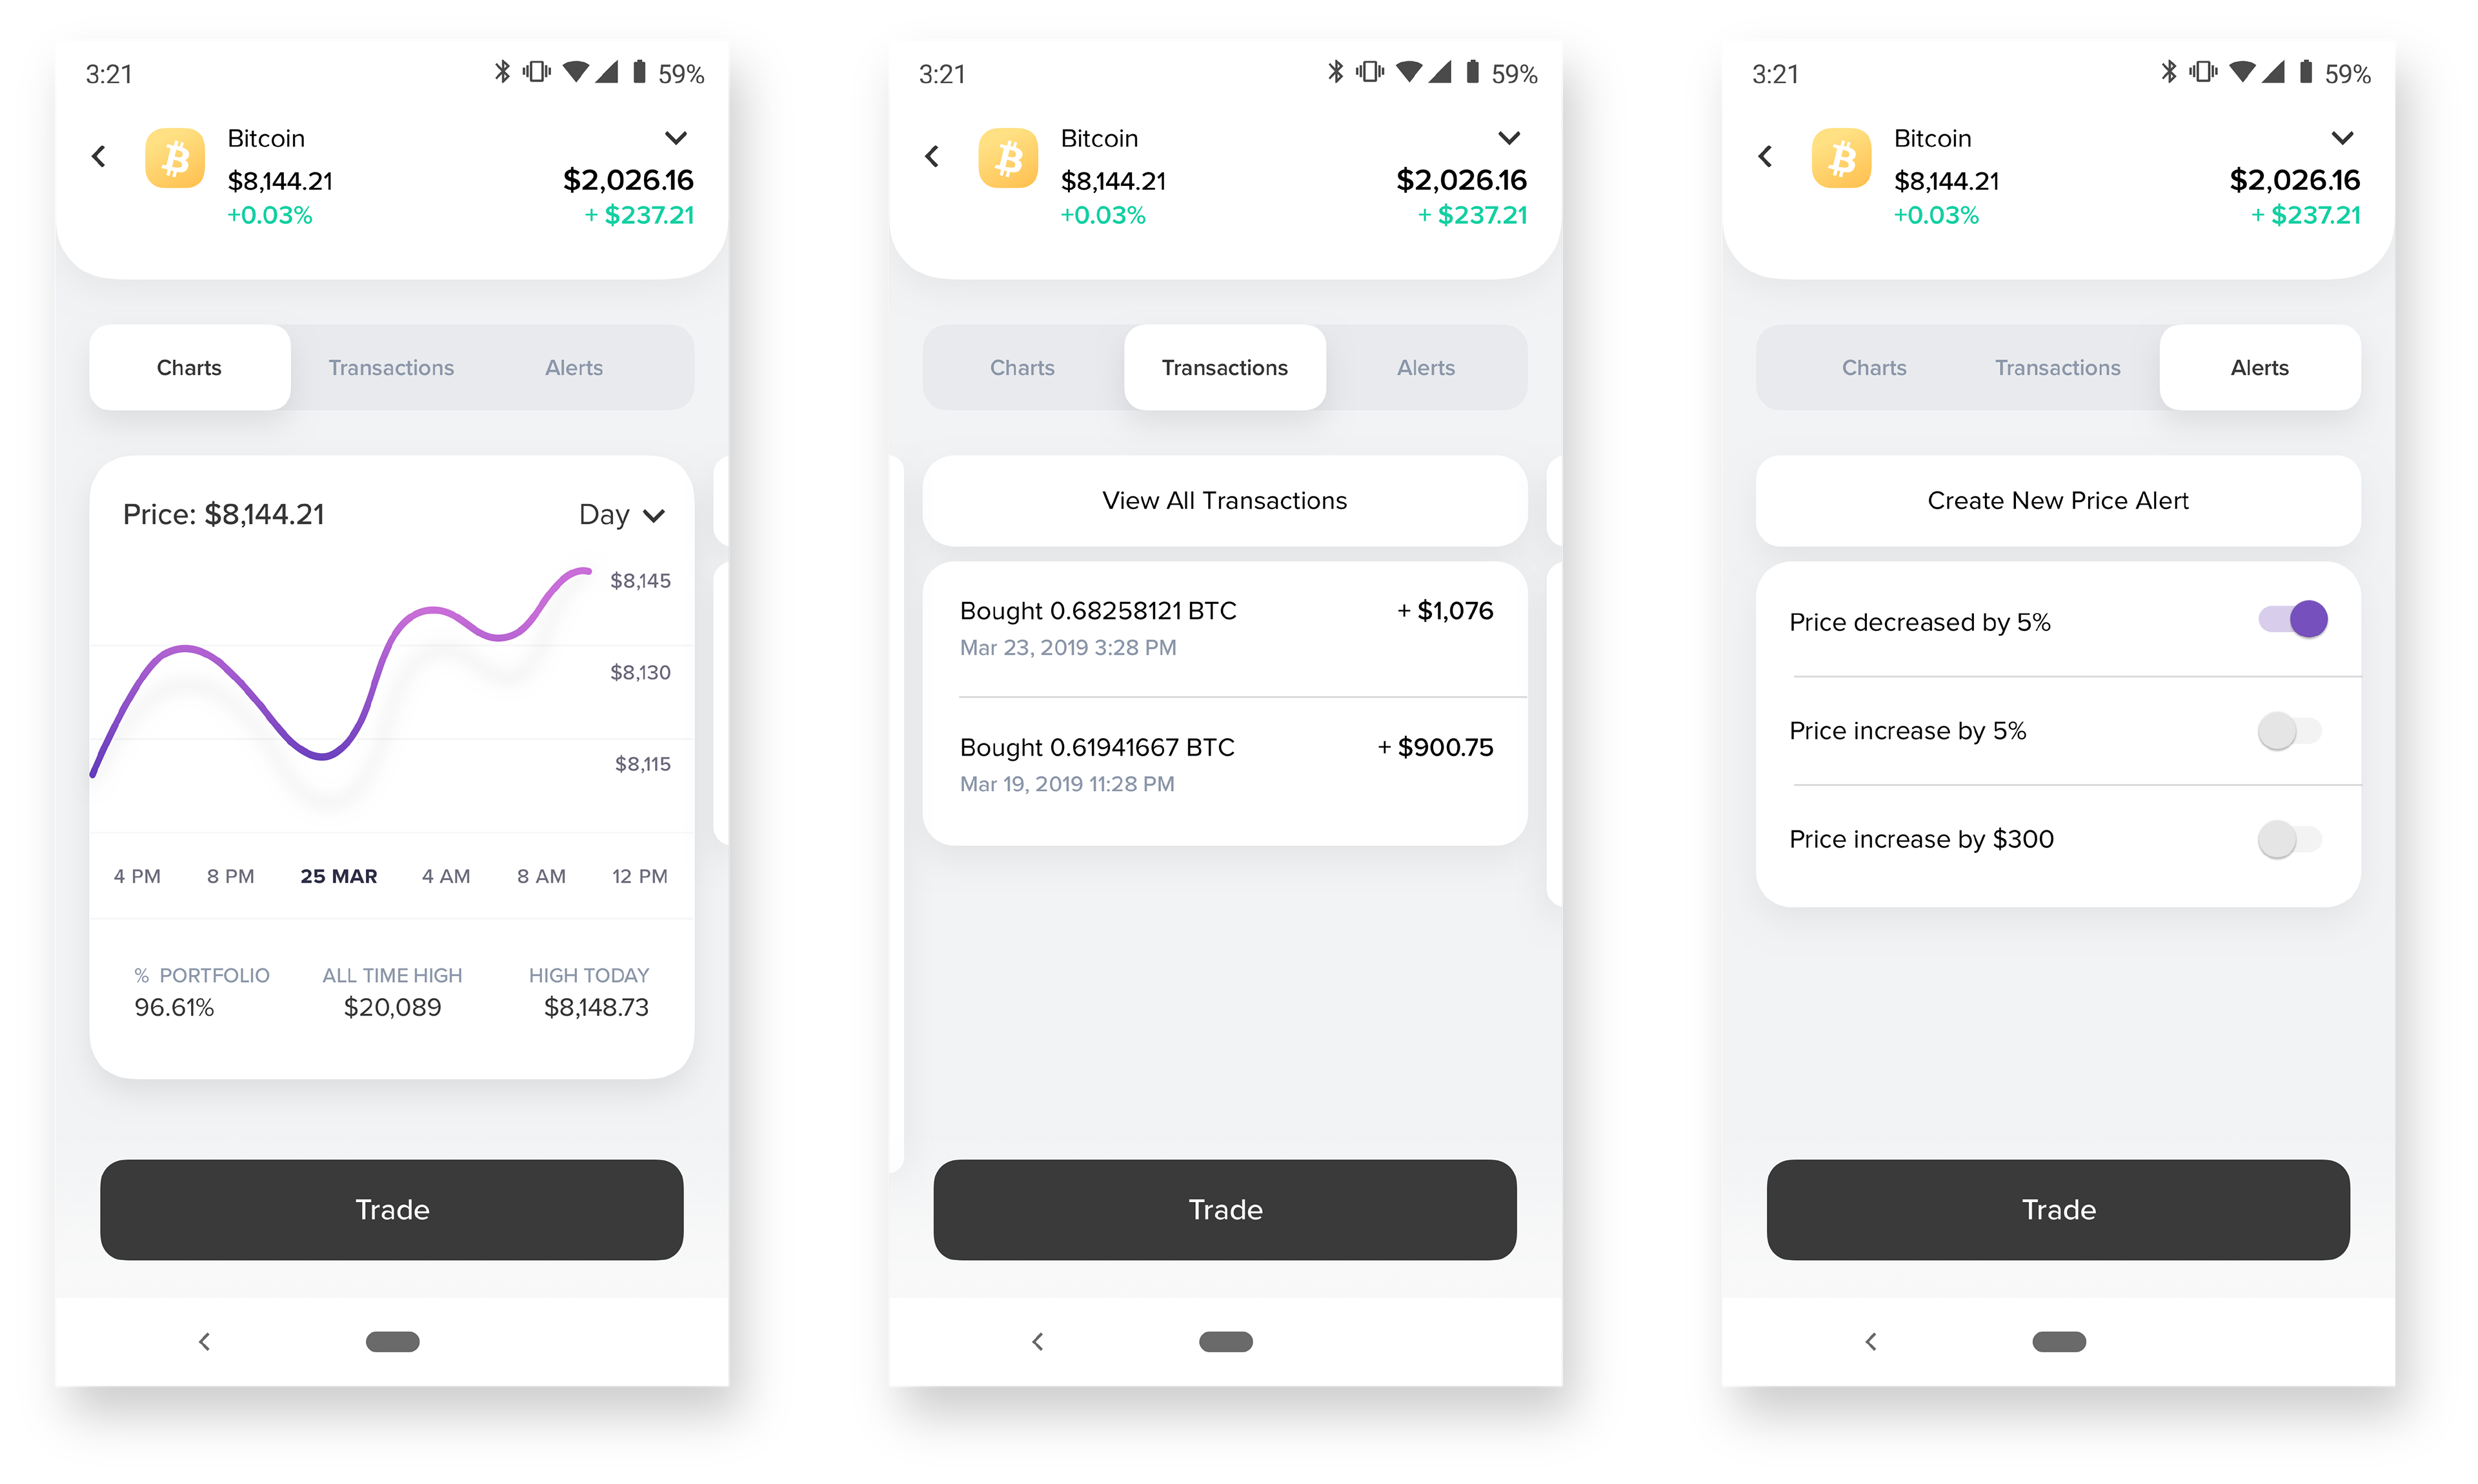
KEY RESULTS & OBJECTIVES
- Allow users to see price data over time
- Indicate transactions within the chart
- Display time intervals the data can be filtered
- Indicate transactions within the chart
- Display time intervals the data can be filtered
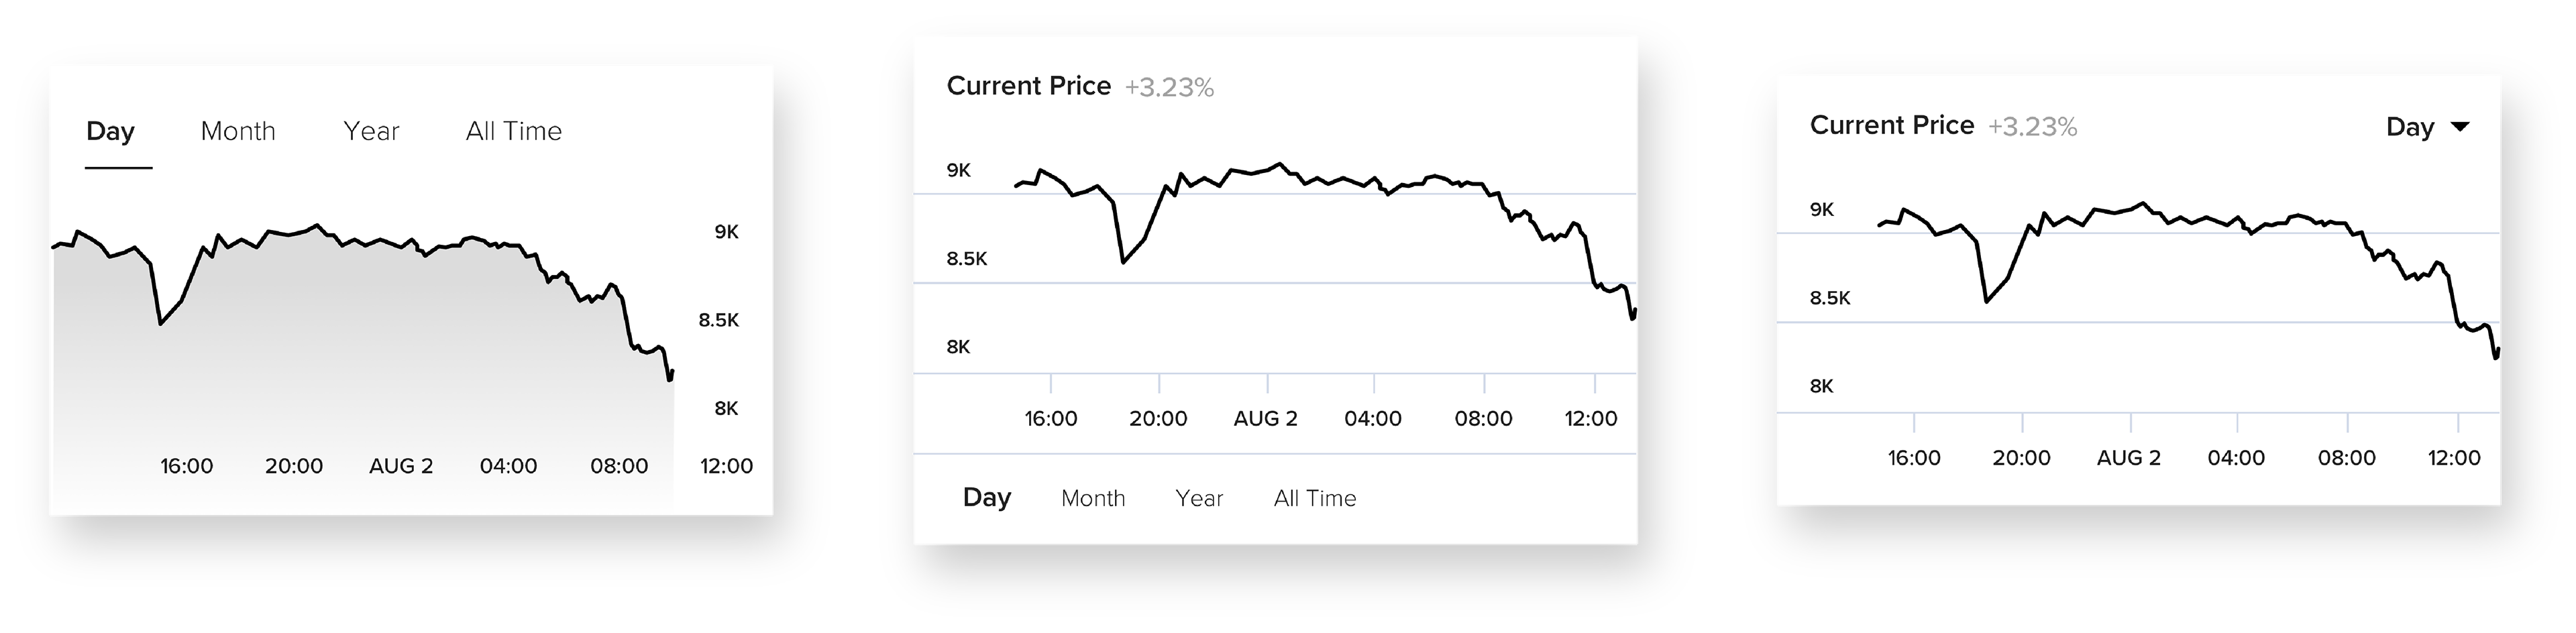
WIREFRAMES
Everything's got to start somewhere. We started testing 3 basic variations of charts both internally and with users. We gathered their feedback on how they access and utilize their charts as well as any issues they found in our examples. Internally there was a strong emphasis on keeping the chart size small, yet capable of showing extreme sets of data.
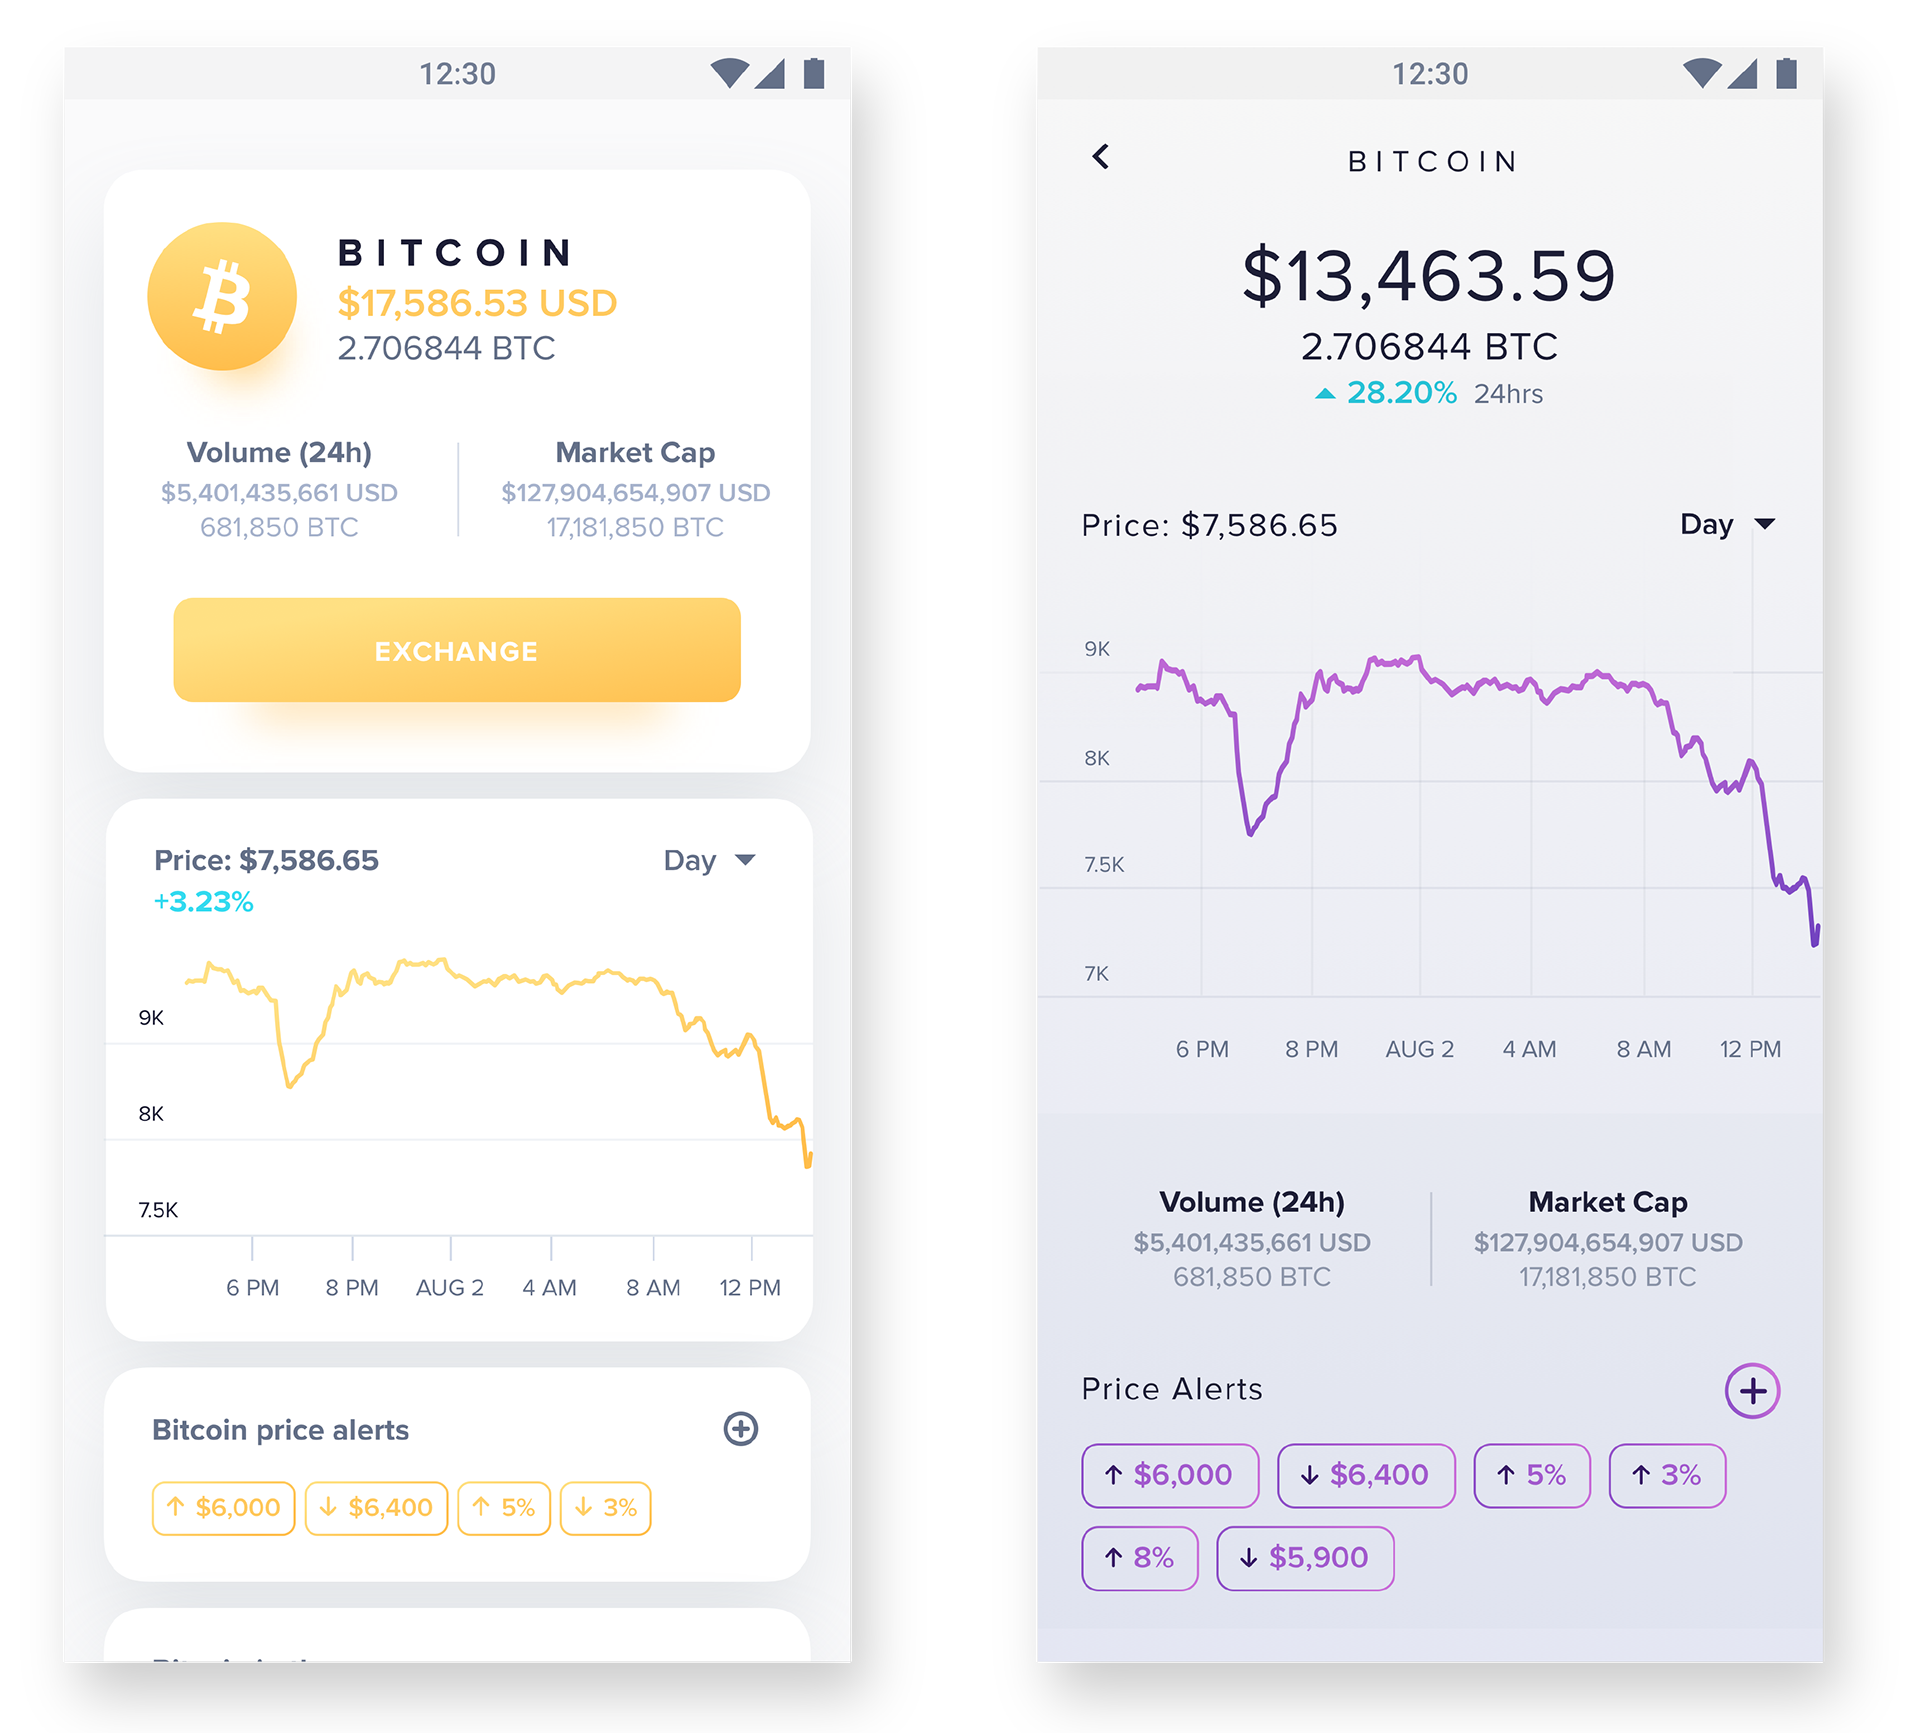
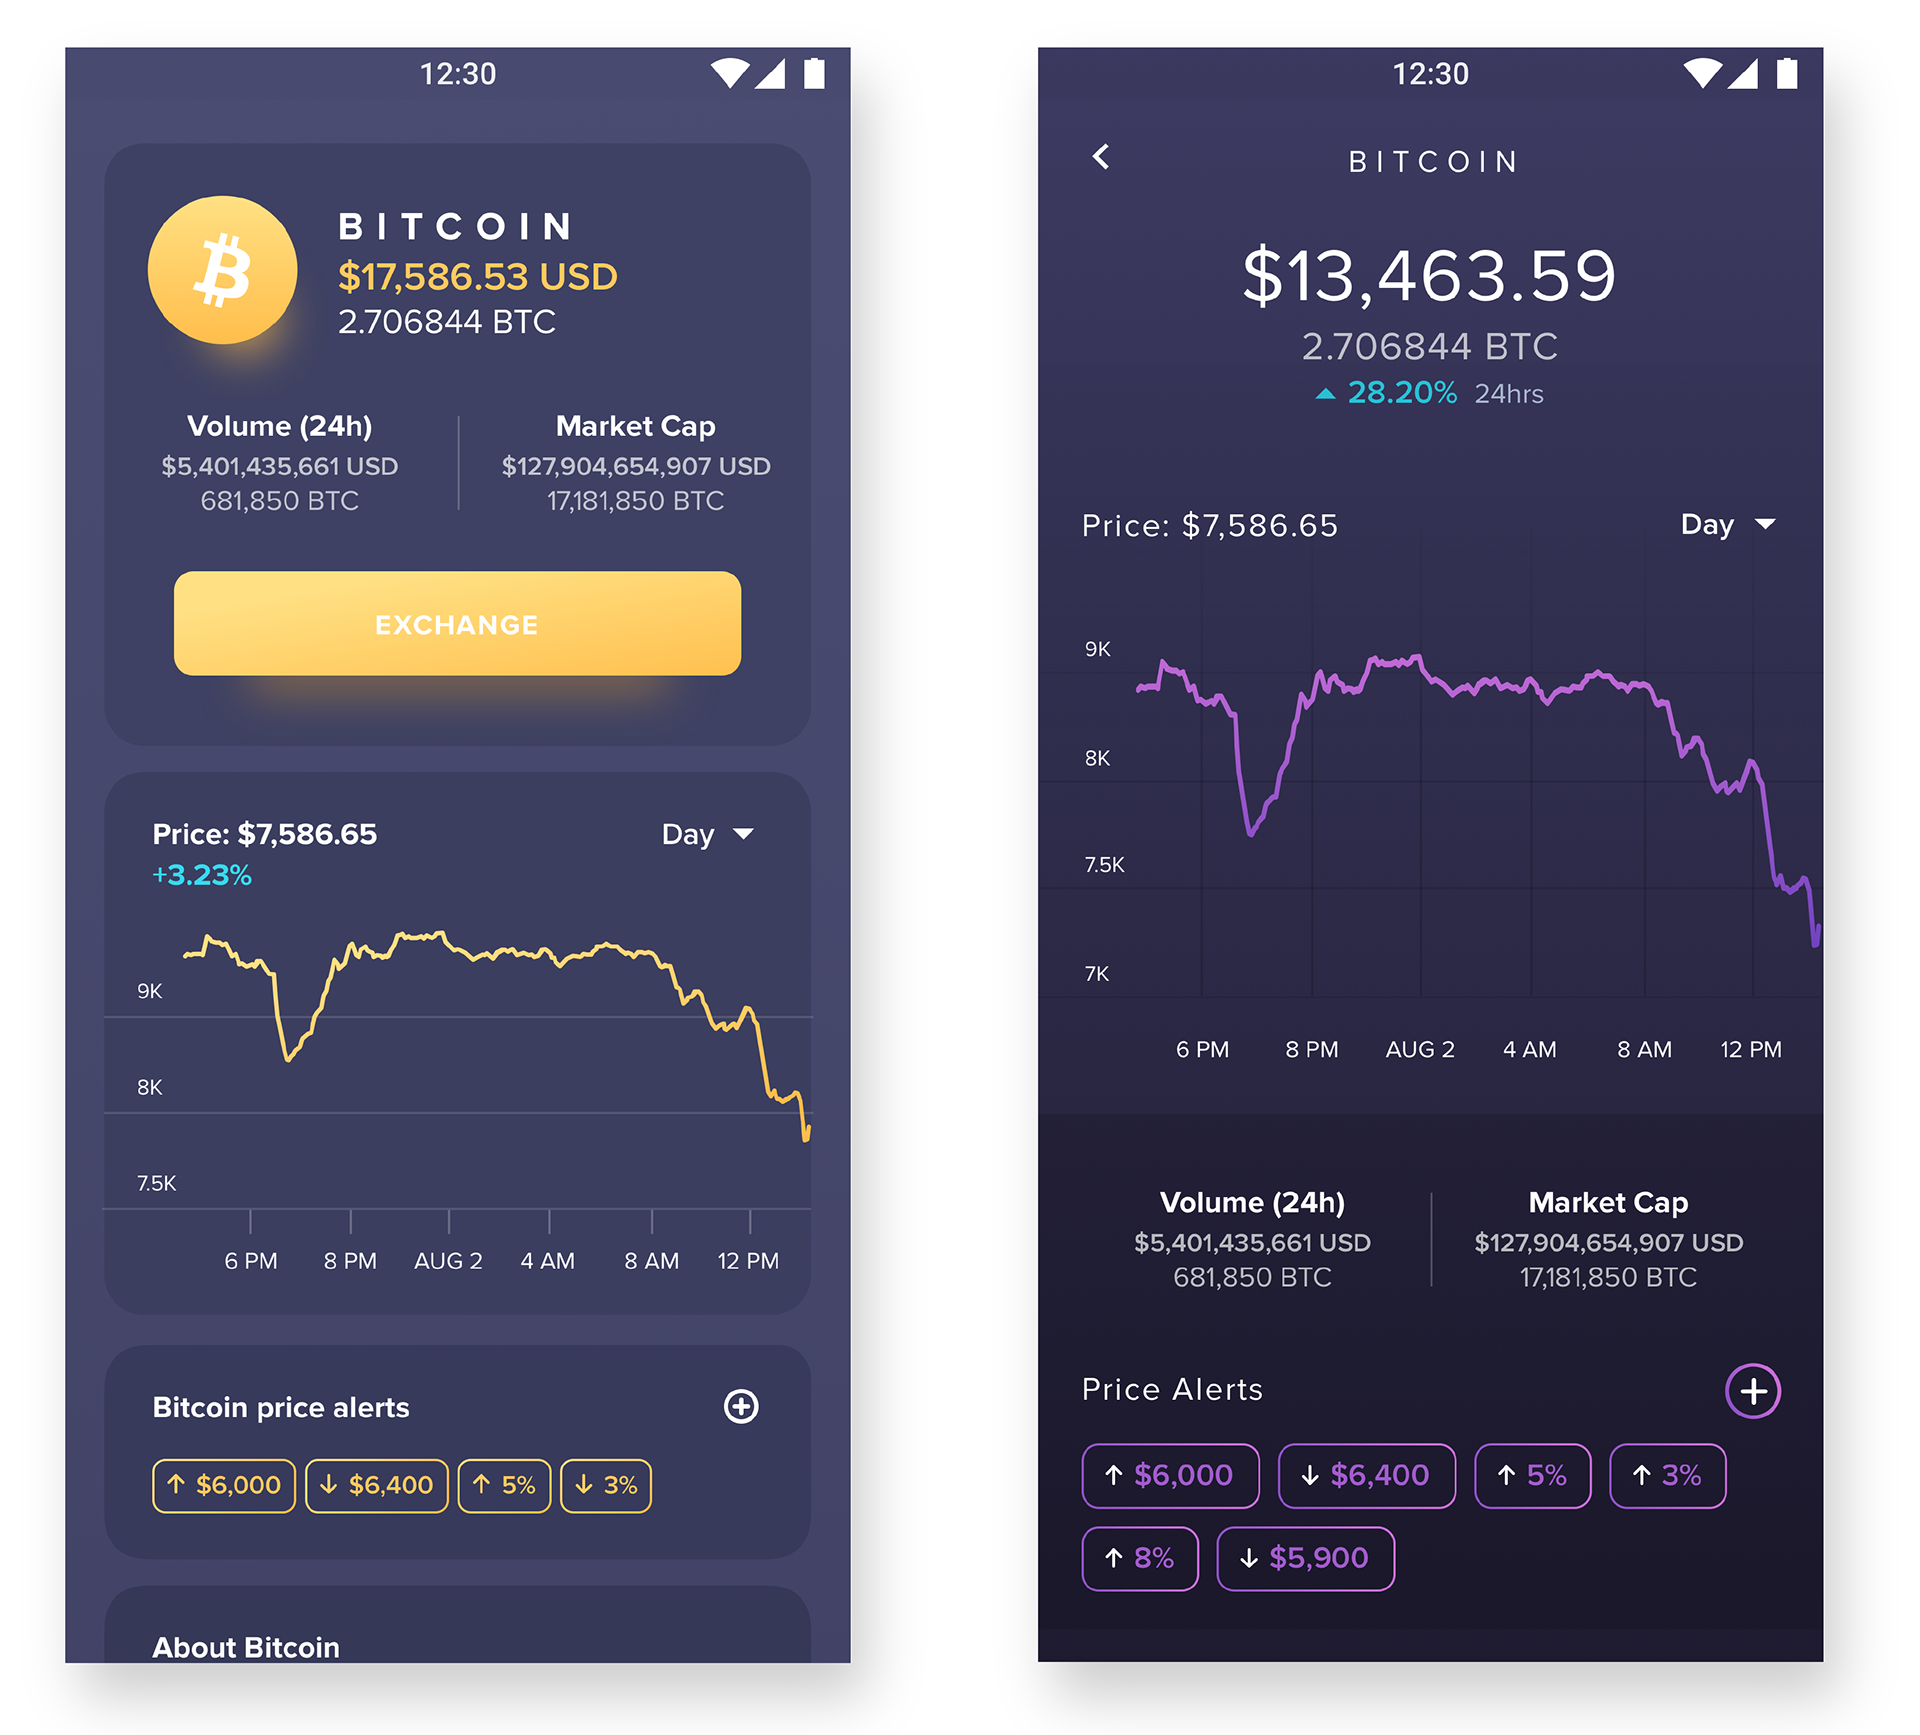
VISUALS & NEXT STEPS
After our brief testing we began building out the feature. As with other projects at Abra, the feature had to adhere to the legacy design system as to fit in with the other elements. This was our version 1 of the feature upon release:
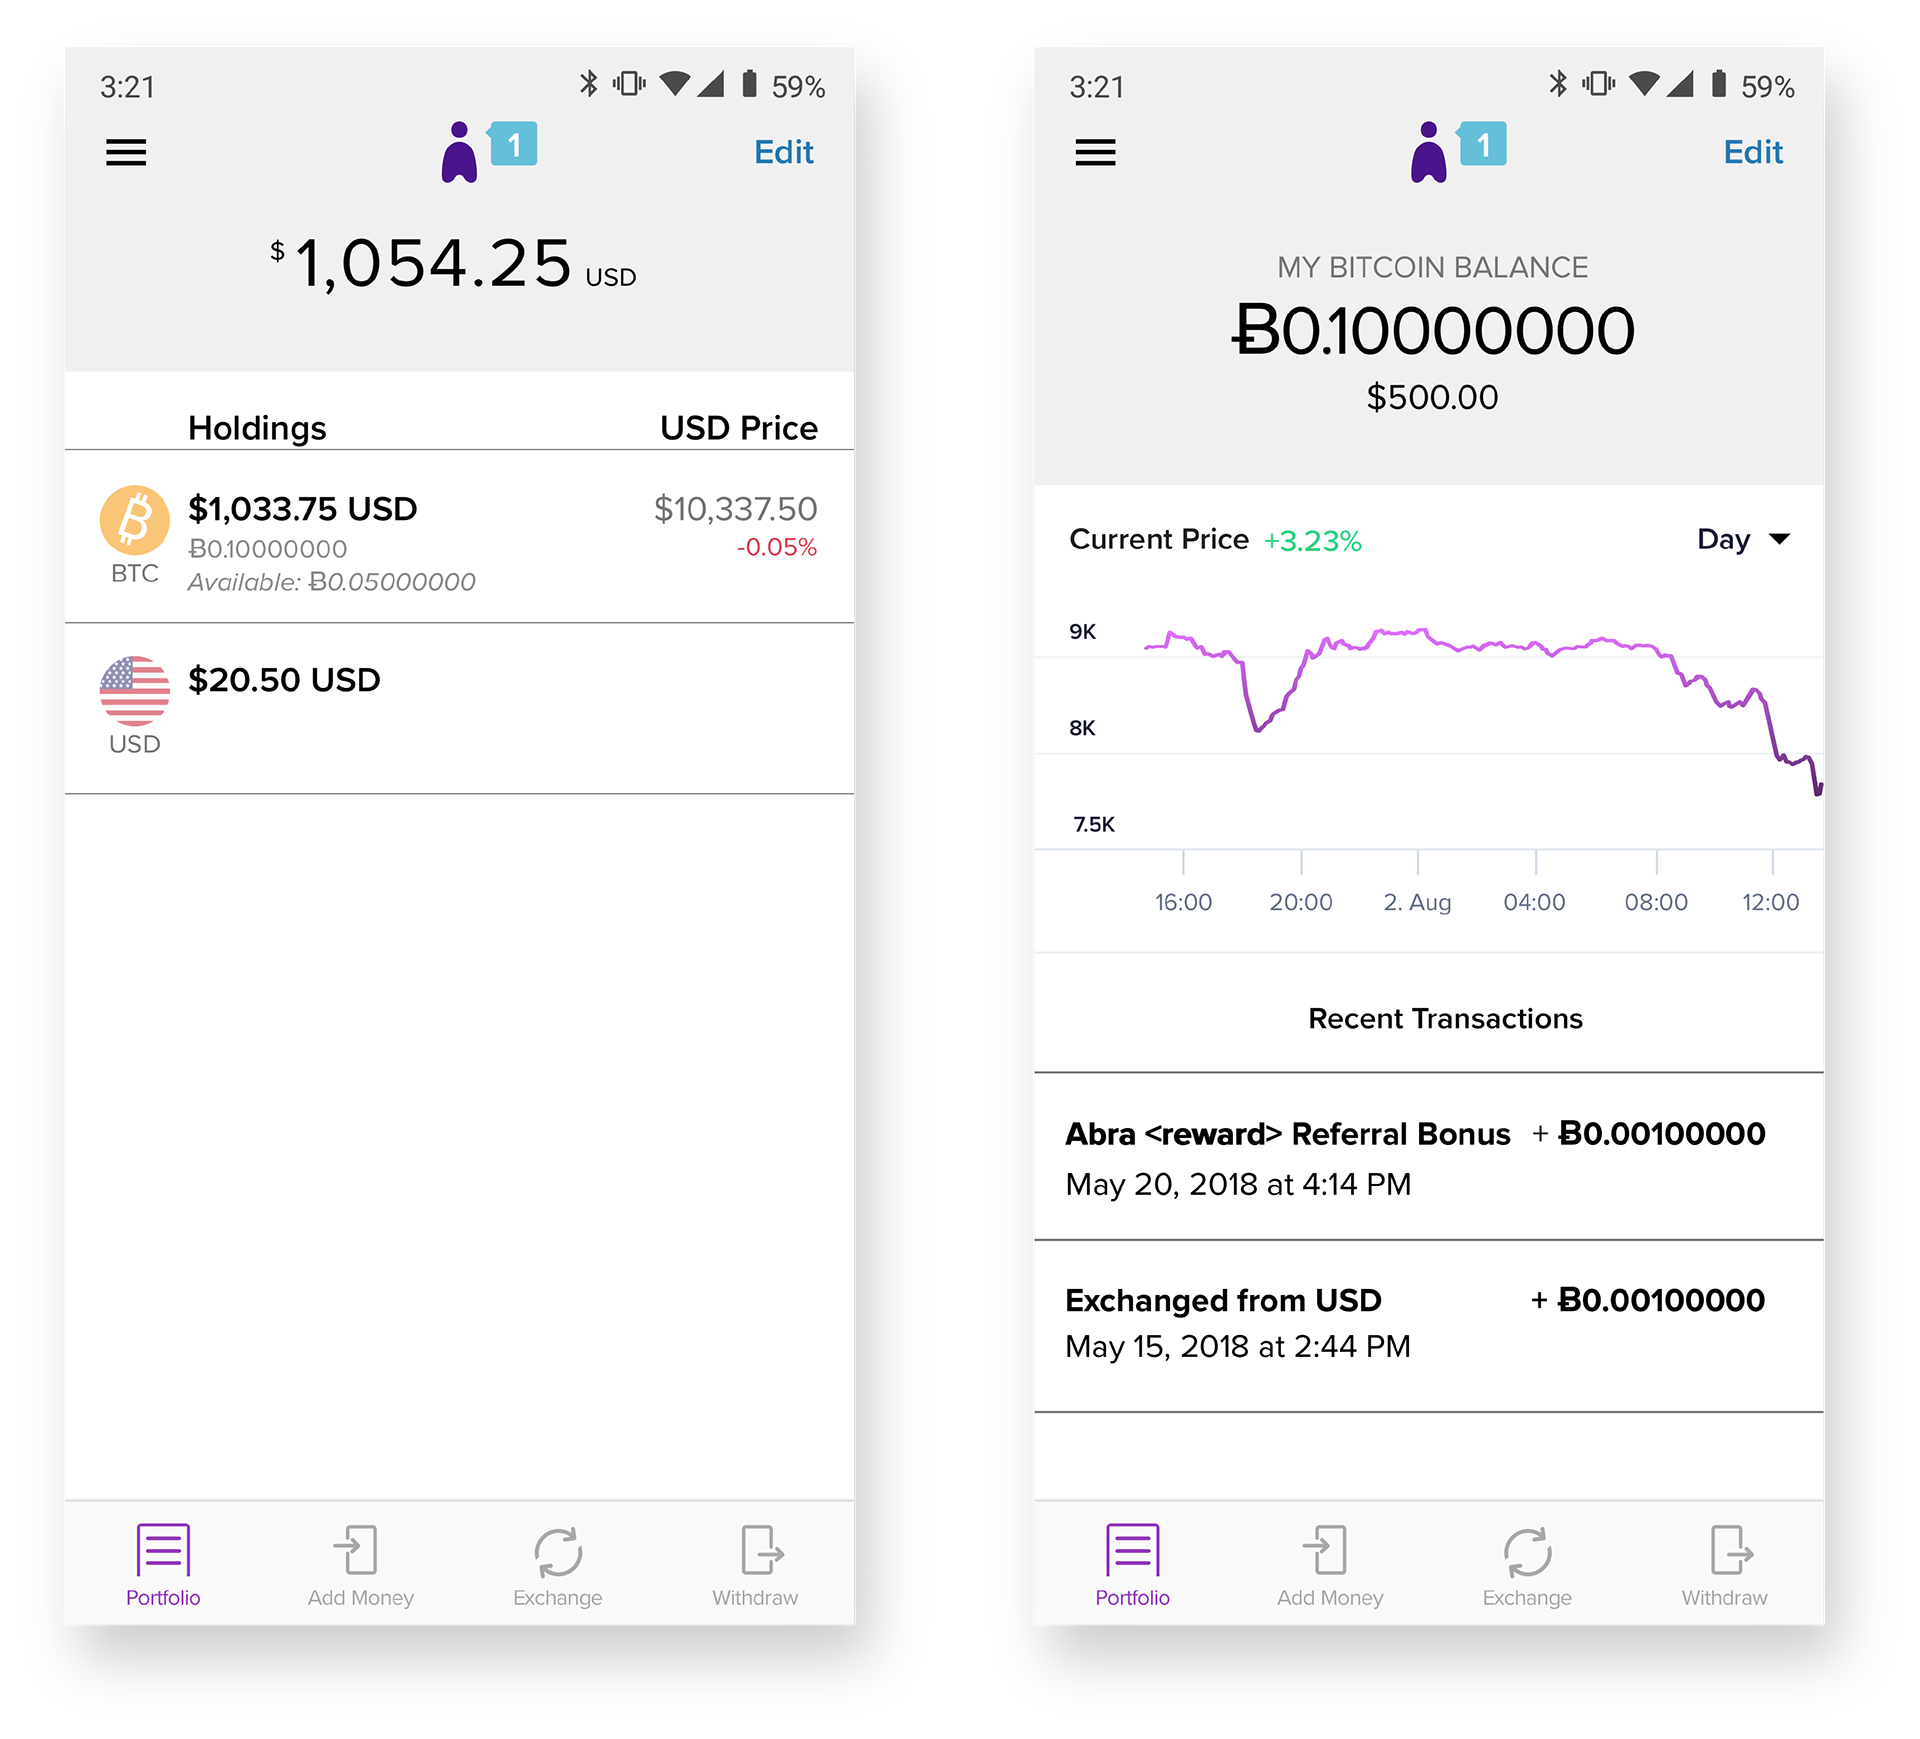
Looking forward, we would want to update the chart layout as well as how to provide a better viewing experience on the individual currency pages.
ADDITIONAL EXPLORATIONS